Global Credit Data collects raw data from its members and distributes it back to them for use in their own analysis and modelling.
Full data return and reference data set
Member banks always receive a full data return of the aggregated data and are encouraged to create their own filters to produce a representative data set appropriate to their bank’s geographical presence, business types and practices. This enables banks to use the data for different tyes of benchmarking tailored to their needs. For further information, please check our Reference Dataset Guidelines
The ultimate benchmarking: Peer Comparison reports
Global Credit Data returns – next to the full data set – the so-called ‘peer comparison reports’ . Such an analysis can be generated for any credit risk metric available in the template (LGD levels, Time-to-recovery, PD levels, default rates, expected loss, …) and compares “your bank” against the distribution of the data pool (minimums, maximums, medians, averages and percentiles). A “box plot analysis” provides richer views of and detailed insight into the data pool and gives each member bank an instant view on how they compare to their peers.
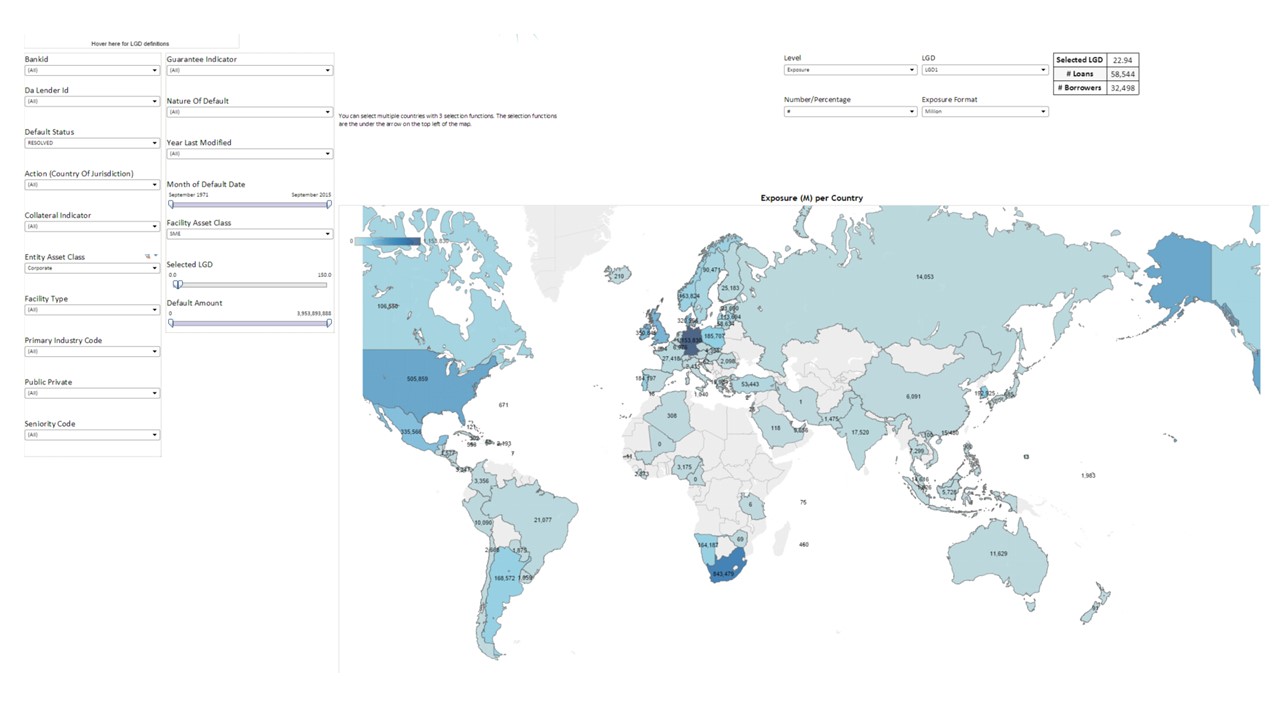
Easy acess to our data
GCD supports its members by providing a flexible high-end tool on the data pool: the GCD Visual Analyzer. Member banks can create dynamic Reference Data Sets and generate instant views on the data.