Data Pools
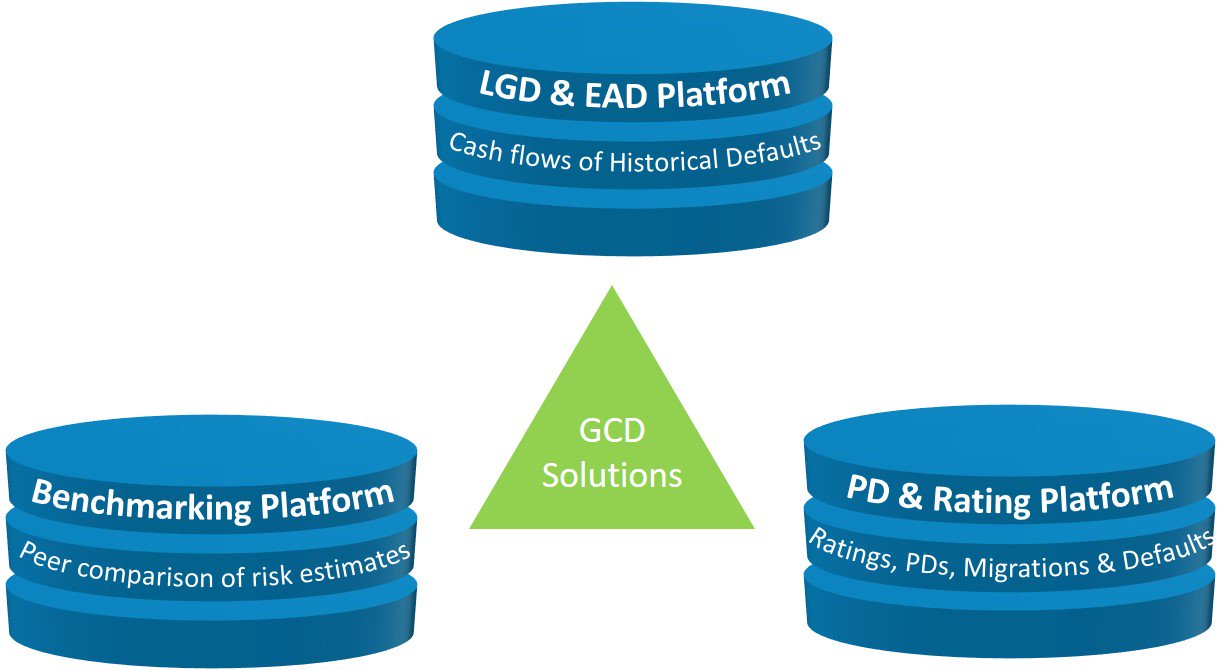
GCD is operating three worldwide datapools that offer our members an objective benchmark for their internal model parameter. Our members profit from instant access to more than 15 years of data, accompanied by high-level analytics and benchmarking reports.
GCD data is detailed enough to develop or enhance internal LGD models or for validation, calibration, or benchmarking. These models can be used to support:
- Internal Ratings-Based approach (IRB),
- to fulfill the credit provisioning standards IFRS9 or CECL,
- for stress testing and also
- for economic capital and pricing.

LGD & EAD Platform
What we do
GCD is collecting data related to credit failures (default) dating back early 1980s, allowing for meaningful statistics in terms of the type of borrower, time and size of exposure at default, and collateral recovery rates.
Data is collected and analysed separately various Basel 2 asset classes and supports various definitions of LGD and credit conversion factors (CCF).
The LGD and EAD parameters are most demanding in terms of multiple and precise data on the obligor, the loan and surrounding circumstances. At the current stage, Global Credit Data offers a mature structure for LGD/EAD pooling, which the Member-banks can and do adopt in their internal databases. Global Credit Data is internationally recognized as the standard for LGD and EAD data collection.
How can the database be embedded in your regular processes
Some concrete use cases are:
- Identify risk-drivers on a more diverse dataset (e.g. Segmentation, LtV, Time-to-Recovery, …)
- Identify macro-economic dependencies of LGD and EAD
- Prove the correct LGD levels for Low Default Portfolios (e.g. banks, shipping)
- Correctly calibrate downturn or stressed LGDs from long time series
- Reduce uncertainty add-ons for lack of data
- Benchmark historical losses with your modelled forward-looking expected losses under IFRS 9 / CECL
- Peer benchmark the LGD estimates underlying your pricing models with loss rates from a global and diverse dataset
For members (login first)
PD & Rating Platform
What we do
In 2009 Global Credit Data started a study of Observed Default Frequencies, i.e. the number of defaults actually counted by a bank in a year within a segment of its obligors. This exercise complements the analyses on LGDs and EADs, and, like them, is strictly historical. In 2015, the data template and process has been amended in such a way that also migration matrices and multi-year defaults rates (both relevant for stress-testing and IFRS 9 impairment modelling) are calculated and given back to the participating banks.
The database input for this datapooling is much simpler than the LGD-EAD database: we are simply asking for quarterly "portfolio snapshots", including basic information such as asset class, country/geographic region, industry, rating category, and PD. All this enables us to calculate and give back default rates, migration rates, and average PDs for a vast amount of different segments - information that member banks can use instantly to benchmark their internal PD systems.
How can the database be embedded in your regular processes
Each year, the PD & rating database is refreshed with more than half a million obligors (at quarterly snapshots). In total 100,000 defaults have been submitted since 2000 by 29 GCD member banks. The data can be split by rating, region, industry and asset class.
This database allows us peer-benchmarking of internal rating models, construction of correlation matrices, and long-term default rates.
Some concrete use cases are:
- Benchmark your PD masterscale (comparison PDs and default rates per rating class)
- Benchmark your system’s discriminatory power
- Identify macro-economic dependencies in default and migration data: Extract a “systemic factor” from rating migrations or default rates
- Benchmark your asset correlations and long term default rates
- Benchmark your stage allocation / SICR buckets (thresholds for “life-time PD” movements) under IFRS 9
- Reduce uncertainty add-ons for lack of data
For members (login first)
Benchmarking Platform
What we do
GCD benchmarking platform allows our members to benchmark the rating and loss estimates of their clients with those of their peers banks. Data exchange of the PD and LGD estimates on a name basis is performed in an anonymized way and treated with absolute confidentiality.
GCD has set up this service recently based on the wish of its member banks who have trusted GCD since years with their data handling and data security. The service offers data for more than 30,000 clients worldwide as well as average PD and LGD levels for pre-defined clusters.
How can the database be embedded in your regular banking processes
- Directly benchmark your risk estimates (PD, LGD, EaD) on specific names and detailed risk clusters with your peers
- Follow changes in risk estimates over time
- Feedback the information in your model development and calibration processes
For members (login first)
Data Quality & Data Standards
GCD adheres to several defining data quality principles built in from when it started in 2004. These principles are used on all pooled data to ensure the data is of the highest quality: correctness, completeness, and comparability.
The elements for controlling data quality are:
Rigourous validation rules
Banks are only able to submit the data if it passes a large number of strict quality tests. Based on these rules – set by the Methodology Committee - the Data Agent checks the data. If the rules are not met, the files will be rejected with an explanation enabling the Memberbank to do the necessary adjustments.
Full resubmission requirement
Banks joining GCD have greatly improved their data quality by cleaning their existing internal data to reach GCD data quality standards, this includes a full data resubmission requirement every 3 years which helps banks keep up to date with improving validations, new fields, and changed definitions.
Data audit by senior credit experts
Scoring System
In order to encourage the member banks to improve the data quality, Global Credit Data has created a scoring system. Each member bank can see how its delivery compares to its peers in terms of data quality. In this way, a member bank can gauge the quality of the data by reference to their own known data quality and can judge the quality of individual elements with which they are concerned in their modelling.
Cleaning during RDS
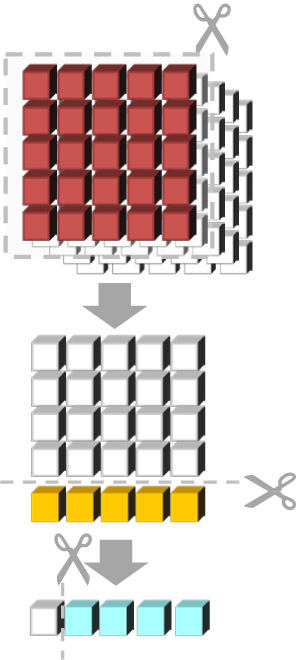
Member banks are also advised and encouraged to examine the detailed raw data they receive to produce their own "representative data set" or RDS which comprises filtering of the data to ensure that it matches the portfolio of the bank which will be using it. During this process, the final data cleaning is done. For further information, please check the Reference Dataset Guidelines.
Reports & Analysis
Global Credit Data collects raw data from its members and distributes it back to them for use in their own analysis and modelling.
Full data return and reference data set
Member banks always receive a full data return of the aggregated data and are encouraged to create their own filters to produce a representative data set appropriate to their bank’s geographical presence, business types, and practices. This enables banks to use the data for different types of benchmarking tailored to their needs. For further information, please check the Reference Dataset Guidelines
The ultimate benchmarking: Peer Comparison reports
Reference Dataset Guidelines
The key to using pooled data is to create a "representative data set" or RDS which comprises filtering of the data to ensure that it matches the portfolio of the bank which will be using it.
Member banks always receive a full data return of the aggregated data and are encouraged to create their own filters to produce a representative data set appropriate to their bank’s geographical presence, business types and practices. This enables banks to use the data for different types of benchmarking tailored to their needs.
For further information, please (login required)
- consult our Reference Dataset Guidelines, which provide
- guidance for LGD modelling in line with the latest regulatory guidances (e.g. from EBA and BCBS)
- an introduction in the Reference Dataset used for the LGD report Large Corporates 2019 and
- examples of RDS for LGD and CCF models created by member banks using GCD data
Please contact any GCD Executive in case of any further questions.


